Search Console says your URLs are Poor or Need improvement under Core Web Vitals. You run PageSpeed Insights and get a score that bounces around between tests. The report names a metric, like "INP issue: longer than 200ms", but doesn't tell you what to change.
Core Web Vitals are three measurements from real Chrome users. Largest Contentful Paint (LCP) measures loading. Interaction to Next Paint (INP) measures how quickly the page responds to clicks, taps and key presses. Cumulative Layout Shift (CLS) measures how much the layout jumps. INP replaced First Input Delay (FID) as a Core Web Vital in March 2024, so older advice about FID no longer applies.
Fixing them is a loop. You find which metric fails and on which page template, you find the specific cause, you ship a fix, and you wait for field data to catch up. This guide follows that loop with the tools Google gives you for free.
Quick answer
- In Search Console, open Core Web Vitals, start with Mobile, and note which metric fails for which URL group.
- Run an example URL in PageSpeed Insights. Trust the real-user (field) section for pass or fail, and use the lab section and its Insights to find causes.
- For LCP: make the main image or text load early, never lazy-load it, and cut server time and render-blocking files.
- For INP: find the slow interaction, break up long JavaScript tasks, and trim third-party scripts.
- For CLS: give images, embeds and ads reserved space, and stop injecting content above what people are reading.
- Deploy to the whole template, then start validation in Search Console (Validate fix; Google's help also calls it Start tracking) and allow the 28-day window to pass.
Before you start
Here's what you need:
- Access to the Search Console property (any permission level can view the report; validation needs Owner or Full user).
- Google Chrome with DevTools for testing.
- Someone who can change templates, image settings, scripts and the server or CDN configuration.
- A staging site or a way to roll back. Performance changes can break layouts or tracking.
Know the thresholds before you start. Google measures each metric at the 75th percentile of page visits, separately for mobile and desktop.
| Metric | Good | Needs improvement | Poor |
|---|---|---|---|
| LCP | 2.5 s or less | Up to 4 s | Over 4 s |
| INP | 200 ms or less | Up to 500 ms | Over 500 ms |
| CLS | 0.1 or less | Up to 0.25 | Over 0.25 |
A page passes Core Web Vitals only when all three are good at the 75th percentile.
Step 1: Find the failing metric and template in Search Console
In Search Console, open Experience > Core Web Vitals. You'll see two cards: Mobile and Desktop, each with an OPEN REPORT link and a count of poor URLs, URLs that need improvement and good URLs. Open Mobile first. Most sites have more mobile traffic and slower mobile results.
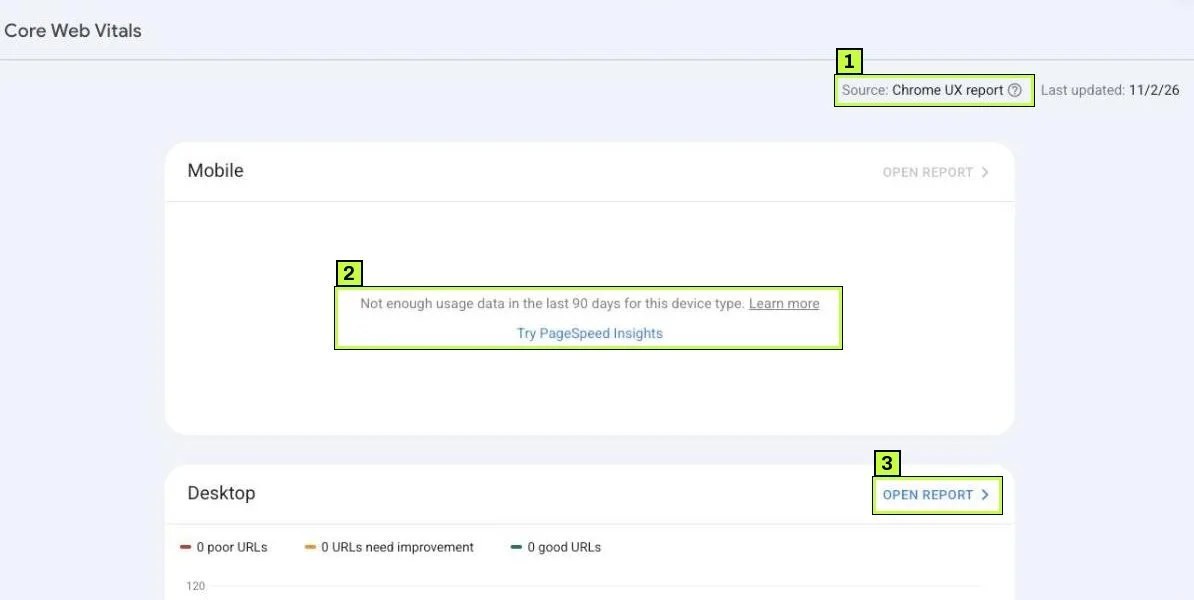
Inside a device report, each issue row names the metric, the device and the threshold it misses, in a form like LCP issue: longer than 4s (mobile) or INP issue: longer than 200ms (mobile). Click a row to see the URL groups behind it. The report groups URLs that behave alike, usually pages built on the same template. Each group takes the status of its worst metric. Click a group to see an example URL and the group's value for that metric.
Write down three things for each issue:
- The metric (LCP, INP or CLS).
- The template behind the group, such as blog posts, product pages or the homepage.
- One example URL.
If a card says Not enough usage data in the last 90 days for this device type, your site doesn't have enough Chrome traffic for that device yet. Search Console only reports indexed URLs with enough real-user data, and the card links to Try PageSpeed Insights instead. Use PageSpeed Insights lab tests and your own measurements until the data builds up.
Step 2: Read PageSpeed Insights the right way
Go to PageSpeed Insights (pagespeed.web.dev), paste the example URL and click Analyze. Pick the Mobile or Desktop tab. The results have two very different parts: Discover what your real users are experiencing (field data) and Diagnose performance issues (lab data).
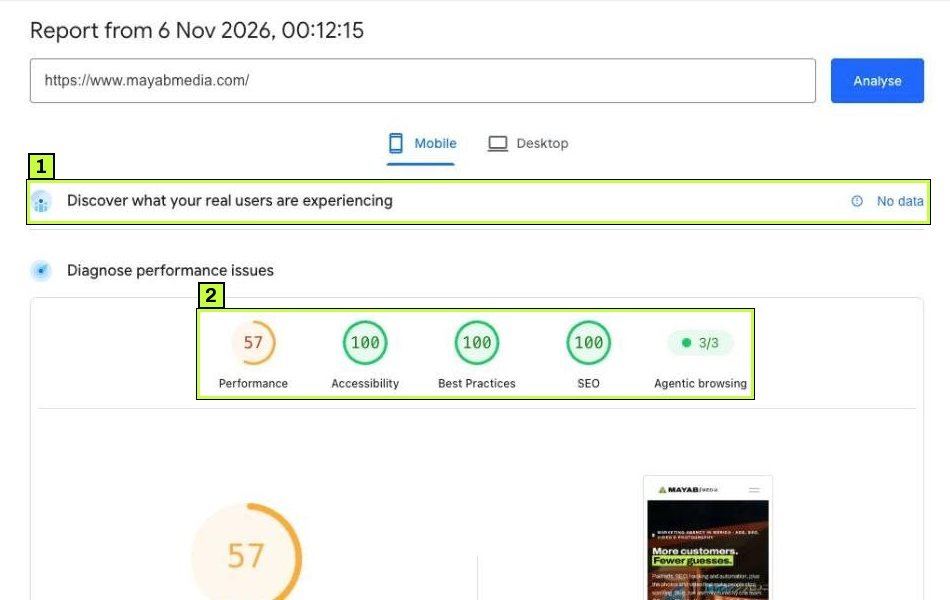
- Field data comes from the Chrome UX Report: real visits over the last 28 days. When there's enough traffic, this section shows a Core Web Vitals Assessment (Passed or Failed) with LCP, INP and CLS. It's the same source Search Console uses. When there isn't, you see No data.
- Lab data is one simulated Lighthouse load on an emulated mid-range phone with throttled network. Use it to find causes, not to judge success. Next to Performance you also get Accessibility, Best Practices, SEO and a newer Agentic browsing check, none of which are Core Web Vitals.
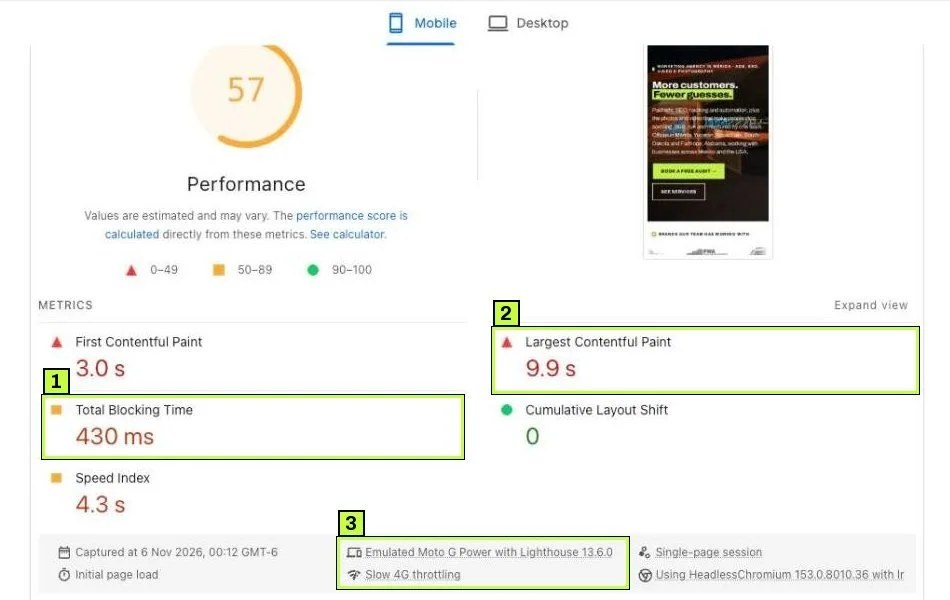
A few rules that save hours:
- The Performance score is not a Core Web Vital. A page can score 60 and still pass, or score 90 and fail on INP.
- Lab tests can't measure INP, because nobody clicks anything. The lab metrics are First Contentful Paint, Largest Contentful Paint, Total Blocking Time, Cumulative Layout Shift and Speed Index. Total Blocking Time is the closest lab hint for INP.
- If the This URL tab has no data, switch to Origin to see the whole site.
- Field data moves slowly. It's a 28-day rolling window, so a fix shipped today shows its full effect about four weeks later.
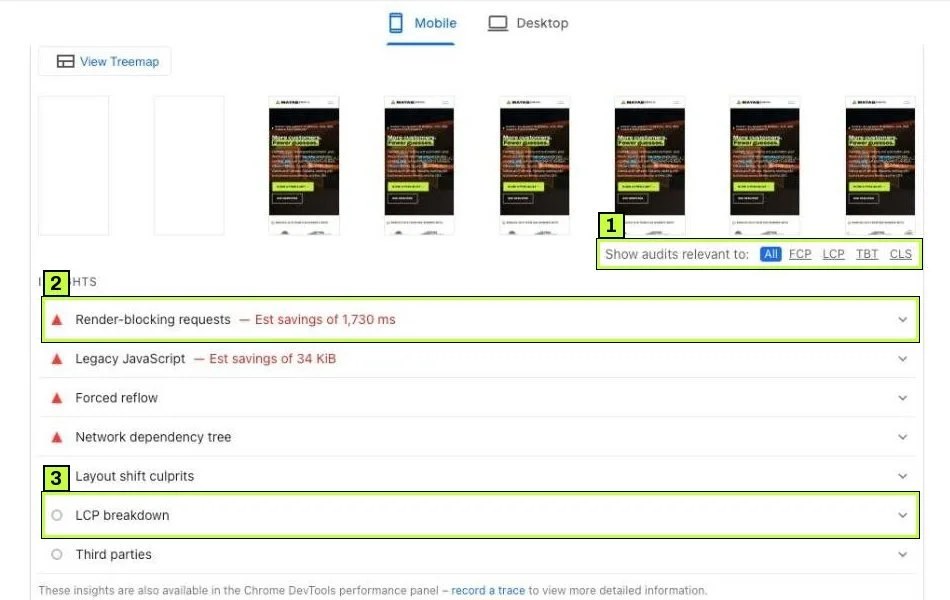
Scroll down past the filmstrip. Since Lighthouse 13, the old audit names (such as "Eliminate render-blocking resources") are gone. Diagnostics now sit under INSIGHTS, with names like Render-blocking requests, LCP breakdown, Layout shift culprits, Network dependency tree, Forced reflow, Legacy JavaScript and Third parties. Which ones appear depends on the page. Use Show audits relevant to: to filter by FCP, LCP, TBT or CLS.
Step 3: Fix LCP (slow loading)
First, find the LCP element. In PageSpeed Insights, click LCP next to Show audits relevant to: and open the LCP breakdown insight. It names the element and splits its time into parts. It's usually a hero image, a large heading or a background image.
The LCP time splits into four parts. Each part has a different fix.
| Part | What it means | Usual fix |
|---|---|---|
| Time to First Byte | Server is slow to send the HTML | Caching, CDN, fewer redirects, faster hosting |
| Resource load delay | The browser finds the image late | Put it in the HTML, preload it, add fetchpriority |
| Resource load duration | The image file is big | Resize, compress, AVIF or WebP |
| Element render delay | Something blocks painting | Fewer render-blocking CSS and JS files |
Make the LCP image load early
The most common problem is a hero image that the browser discovers too late. That happens when it's set as a CSS background, inserted by JavaScript, or lazy-loaded.
<!-- Good: in the HTML, high priority, not lazy -->
<img src="/img/hero-1200.avif"
     width="1200" height="630"
     fetchpriority="high"
     alt="Team working on a website audit">

<!-- If the image is a CSS background, preload it in the <head> -->
<link rel="preload" as="image" href="/img/hero-1200.avif" fetchpriority="high">
Never put loading="lazy" on the LCP image. Many themes and plugins lazy-load every image by default, including the first one. Exclude the hero from lazy loading. Use fetchpriority="high" on one or two images at most.
Shrink the file
Serve an image close to the size it displays at. A 3000-pixel photo shown at 800 pixels wastes most of the download. Use srcset so phones get a smaller file, and use AVIF or WebP.
Cut server time
If the Document request latency insight appears, or the time to first byte part of the LCP breakdown is large, look at the server before anything else:
- Turn on full-page caching or edge caching at your CDN.
- Remove redirect hops. Link straight to the final URL.
- Avoid query strings that bypass the cache, such as unique tracking parameters on internal links.
Remove render blockers
The Render-blocking requests insight lists the CSS and script files that delay the first paint, with estimated savings. Defer scripts that aren't needed to render the top of the page. Remove unused CSS. Move tag managers and chat widgets so they don't block rendering. If you load tags through Google Tag Manager, our guide to installing Google Tag Manager covers the standard async snippet.
Step 4: Fix INP (slow response to clicks and taps)
INP looks at the interactions on a page and reports one of the slowest. Each interaction has three phases:
- Input delay: the browser is busy with other work when the user taps.
- Processing duration: your event handlers take long to run.
- Presentation delay: the browser takes long to paint the result.
Find the slow interaction
Open the page in Chrome. Open DevTools, then the Performance panel. Recent Chrome versions show live local values for LCP, CLS and INP on the panel's start screen as you use the page, plus an Interactions log that lists each click, tap or key press with its element and duration. Click the menu, open accordions, add to cart, submit forms. Watch which interaction pushes INP up.
A short log from that view might look like this (an illustration, not a real capture):
| Interaction | Element | Duration |
|---|---|---|
| pointer | button.add-to-cart | 420 ms |
| keyboard | input#search | 96 ms |
| pointer | nav .menu-toggle | 64 ms |
The slow add-to-cart button is the one to profile. The colors follow the thresholds: green up to 200 ms, red past 500 ms.
Then click Record, repeat the slow interaction, and stop. In the trace, long tasks are marked with a red corner. Expand them to see which script ran. The DevTools Insights sidebar includes an INP breakdown that shows the three phases for that interaction. PageSpeed Insights notes that its insights are also available in the DevTools Performance panel when you record a trace.
For field data on real users, the open-source web-vitals JavaScript library can report the slow element and phase to your analytics. That tells you which interactions hurt on real phones, not just on your laptop.
Common INP fixes
- Break up long tasks. If a click handler does a lot of work, do the visible update first and yield to the main thread before the rest.
- Defer non-urgent work. Analytics events, logging and recalculations can run after the next paint.
- Trim third-party scripts. Chat widgets, heatmaps, A/B testing tools and some tag setups run heavy code on every interaction. Check the Third parties insight. Remove tags you no longer use.
- Keep the DOM small. Very large pages make every style and layout update slower. The Optimize DOM size insight flags this when it applies.
- Avoid forced layout. Reading sizes (like
offsetHeight) right after changing styles forces the browser to recalculate layout. The Forced reflow insight points to the code.
// Show the result first, then yield before the heavy work
button.addEventListener('click', () => {
  showSpinner();                 // visible update right away
  setTimeout(() => {
    recalculateCart();           // heavy work runs after the next paint
    sendAnalyticsEvent();
  }, 0);
});
In browsers that support it, scheduler.yield() does the same job with less delay. Check support before you rely on it, and keep a setTimeout fallback.
Step 5: Fix CLS (layout jumps)
Click CLS next to Show audits relevant to: and open the Layout shift culprits insight in PageSpeed Insights or in a DevTools trace. It lists the elements that moved and, often, the reason: an image without size, a web font, or injected content.
In an expanded Layout shift culprits insight, you're reading something like this (an illustration):
| Element | Shift | Likely cause |
|---|---|---|
| div.promo-banner | 0.18 | Injected content |
| img.hero | 0.06 | Unsized image |
| h1 | 0.03 | Web font |
Fix the largest shift first. One banner often accounts for most of the score.
Common CLS fixes
Size every image and video. Add width and height attributes. The browser uses them to reserve the right space, even with responsive CSS.
img { max-width: 100%; height: auto; }   /* keeps the ratio from width/height */
.video-embed { aspect-ratio: 16 / 9; }   /* reserve space for iframes */
.ad-slot { min-height: 250px; }          /* reserve the most likely ad size */
Reserve space for late content. Cookie banners, promo bars, ads and "related products" blocks often load after the page renders and push content down. Give them a fixed slot with min-height, or show them as an overlay that doesn't move the page.
Tame web fonts. When a web font swaps in, text can change size and shift lines. Preload the main font file, choose a close fallback font, and consider font-display: optional or metric overrides like size-adjust so the swap doesn't move text.
Animate with transform. Animating top, left, height or margin moves other elements. Use transform instead.
Check the back/forward cache. Pages restored from the bfcache don't repeat their load shifts. Avoid things that make pages ineligible, such as unload handlers.
Lab tools only see shifts during load. If your field CLS is much worse than the lab value, the shifts happen later: while scrolling, after a click, or when lazy content loads. Reproduce that flow in DevTools with the live metrics open.
Still not working? Common causes
| Symptom | Likely cause | Fix |
|---|---|---|
| Lab score improved but Search Console didn't move | Field data is a 28-day rolling window | Wait about four weeks after the full deploy before judging |
| PageSpeed score changes every run | Lab tests vary with network and server load | Run three times and compare the median; rely on field data |
| LCP fine on desktop, poor on mobile | Large images, slow CPU, heavy JavaScript on phones | Serve smaller images with srcset and cut JavaScript on mobile |
| LCP image still slow after preload | It's lazy-loaded or hidden in a slider | Remove lazy loading; make the first slide a real img tag |
| INP poor but lab looks clean | Lab tests don't interact with the page | Use DevTools live metrics and test real clicks on a mid-range phone |
| INP got worse after adding tags | New third-party scripts run on every click | Remove unused tags, delay non-essential ones, review Third parties |
| CLS only bad in the field | Shifts after load (ads, infinite scroll, banners) | Reserve space and reproduce while scrolling |
| A URL group is missing from the report | Not enough Chrome traffic for that group | Use the Origin view in PageSpeed Insights or your own RUM data |
| Validation failed | Some URLs in the group still fail | Fix the template everywhere, including variants like AMP or filtered pages |
Caching plugins that cause new problems
Optimization plugins can help, but some settings backfire. Combining all JavaScript into one file can create a single long task that hurts INP. Lazy-loading every image hurts LCP. Delaying all scripts until interaction can break forms and tracking. Turn options on one at a time, test, and keep notes.
Hosting limits
If TTFB is high even on a simple cached page, the server may be the bottleneck. A CDN with page caching often helps more than any front-end tweak. If you can't cache (for example, logged-in or cart pages), work with your host or developer on database and backend speed.
How to confirm it's fixed
Check right after deployment:
- Run the example URL in PageSpeed Insights again. The lab LCP, TBT and CLS values should improve, and the insights you worked on should drop from red to gray or disappear.
- In DevTools live metrics, repeat the slow interactions. INP should stay under 200 ms on a throttled CPU.
- Use URL inspection > TEST LIVE URL in Search Console on a couple of pages to make sure Google still renders them correctly after the changes.
Then start validation in Search Console. Open the issue in the Core Web Vitals report and click VALIDATE FIX (Google's help calls this button Start tracking, so the label can vary). Search Console monitors the affected URLs for 28 days. If the issue doesn't appear on any URL in that window, it's marked as fixed.
In PageSpeed Insights, the field data section updates as the 28-day window rolls. Expect a gradual change rather than a jump.
Faster pages also help discovery and crawling. If new pages are slow to appear in Google, see how to get Google to index your site.
FAQ
Do Core Web Vitals affect rankings?
They are part of Google's page experience signals. Good scores won't save weak content, and poor scores rarely sink a great page on their own. Treat them as a user experience fix that also removes a ranking risk.
Why does PageSpeed Insights show "No data" for field data?
The URL doesn't have enough Chrome visits in the Chrome UX Report. Switch to Origin for the site-wide view if it has data, or collect your own real-user data with the web-vitals library.
Is FID still measured?
No. INP replaced FID as a Core Web Vital in March 2024. Remove FID from your reports and dashboards.
What should I fix first?
Start with the metric that fails on the template with the most traffic, usually on mobile. One template fix often moves hundreds of URLs at once.
Does structured data or schema affect Core Web Vitals?
Not in a meaningful way. A JSON-LD block is small and doesn't render. If you're adding it, see how to add schema markup and test it.
Stuck on this one? We fix these for clients every week. Book a free audit
