Your GA4 property shows zero users. Or Realtime shows visitors but the standard reports are empty. Or page views come in but your form or purchase events never appear. The data stream page might even say data collection isn't active.
GA4 data travels through four checkpoints: the tag loads on the page, the browser sends a hit to Google, GA4 receives it in the right property, and GA4 processes it into reports. When data is missing, one of those checkpoints is broken. The trick is to test them in order instead of guessing.
This guide gives you that order. You'll confirm the property and stream, check the tag with Tag Assistant and the browser, watch hits arrive in Realtime and DebugView, and then rule out the settings that silently drop data: consent, filters, duplicate tags and processing delays.
Quick answer
- Confirm you're in the right GA4 property and that the web stream's measurement ID matches the one on your site.
- Use Tag Assistant to check that the Google tag loads and sends hits to that ID.
- Visit the site yourself and look for your visit in Reports > Realtime overview.
- Turn on debug mode and open Admin > DebugView to see each event and its parameters as it arrives.
- Check consent mode, data filters and duplicate tags if hits are sent but don't show up.
- If Realtime works but reports are empty, wait. Standard reports can take 24 to 48 hours to process.
Before you start
You need:
- Access to the GA4 property. Viewer access is enough to look at reports. Changing streams, filters or settings needs Editor or Administrator.
- Access to Google Tag Manager, if GA4 runs through GTM, or to the site code if it's hard-coded.
- Chrome with the Tag Assistant extension, and ad blockers turned off while you test.
- Ten minutes of quiet time on the site. Testing is easier when you can spot your own visit.
Write down the measurement ID you expect (it starts with G-). You'll compare it at every step.
Don't change data filters or delete anything yet. Filters in GA4 are permanent in effect: data they exclude is never processed and can't be recovered.
Step 1: Confirm the property and data stream
Many "no data" problems are the wrong property. Agencies and plugins often create a second property, and the site sends data to one while you look at the other.
In GA4, click Admin. Under Data collection and modification, click Data streams, then click your web stream.
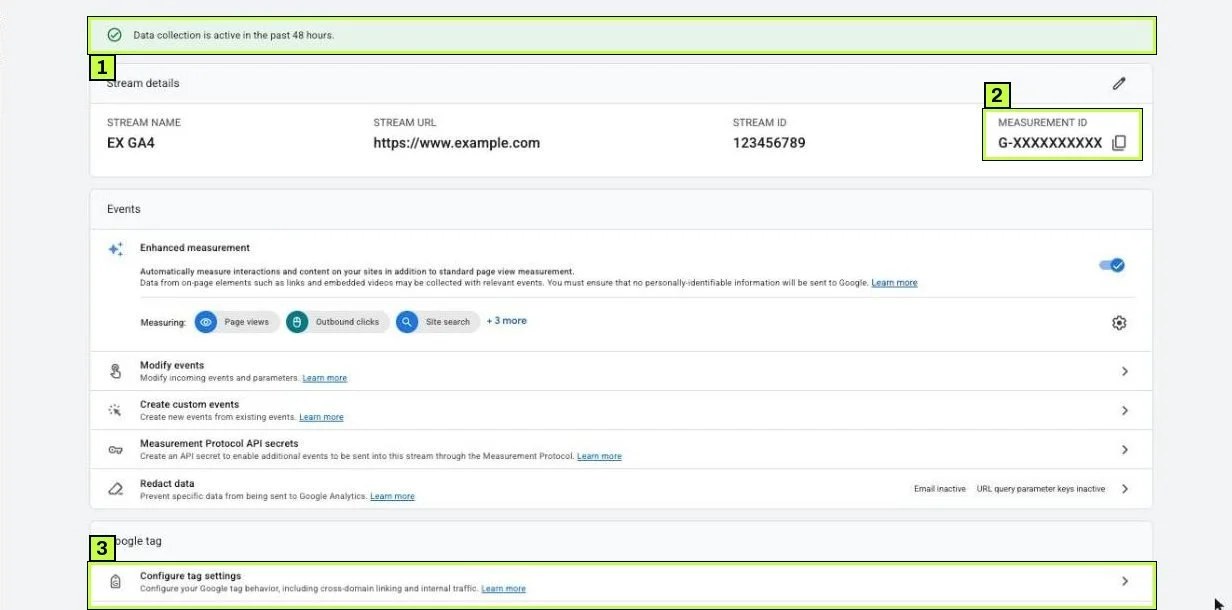
The green banner here reads Data collection is active in the past 48 hours. If GA4 hasn't received hits for this stream recently, you see a warning in the same spot instead, saying data collection isn't active. The exact wording can vary. Copy the MEASUREMENT ID with the icon next to it. It must match the ID in your tag exactly.
Also check the account and property name at the top of the screen. If you manage several, open the property picker and make sure you're in the one tied to this website.
If the stream shows recent data but your reports look empty, skip ahead to Step 5 and Step 6. The tag works. Something is filtering or delaying the data.
Step 2: Check the tag on the page
Now confirm the site sends data to that ID.
With Tag Assistant
Open tagassistant.google.com and click Add domain. Enter your site URL and click Connect. Your site opens in a new window, and Tag Assistant shows every Google tag it finds.
The Tag Assistant window lists each tag ID it found on the page (your GTM- container and your G- Google tag) and, in a timeline on the left, every event the page sent: page view, scroll, clicks and so on. Click a tag ID and then an event to see which hits went out and with which parameters.
Check two things:
- Your GA4 ID appears. If it's missing, the tag isn't installed or never fires.
- No hits go to an unexpected
G-ID. A second ID usually means an old plugin or a duplicate tag is still on the site, and some of your data is going to another property.
If you see no Google tag at all, the install is the problem. Our guide to installing Google Tag Manager correctly covers the snippet, caching and platform quirks.
If GA4 runs through GTM, also check the container in GTM Preview. The Google Tag with your G- ID should be under Tags Fired on page load. If it's under Tags Not Fired, check its trigger, and check whether consent settings are holding it back.
With the browser
You can also check the raw hits. Open Chrome DevTools, go to Network, and type collect in the filter. Reload the page.
You should see requests to a URL containing /g/collect with tid=G-XXXXXXXXXX and en=page_view. A status of 204 means Google accepted the request. If the request shows as blocked, an extension, a browser privacy feature or a network filter is stopping it.
https://region1.google-analytics.com/g/collect?v=2&tid=G-XXXXXXXXXX&...&en=page_view&...
Status: 204
The host can vary (for example www.google-analytics.com or your own domain if you use server-side tagging). What matters is the tid and the en value.
Step 3: Look for your visit in Realtime
Open your site in a normal browser window, with no ad blockers, and click through a few pages. Then go to GA4 and open Reports > Realtime overview.
Realtime overview covers the last 30 minutes. It shows active users in the last 30 and 5 minutes, then cards for users by first user source and audience, views by page title and screen name, event count by event name, and key events by event name.

Your visit should appear in the Active users in last 30 minutes and Active users in last 5 minutes counters at the top of the page within a minute or so. Then check the Event count by Event name card. An event you expect but don't see there means that specific tag or trigger isn't working. Click the card title to switch to other dimensions if you need them.
Realtime has limited attribution, so don't use it to judge sources. Use it only to confirm that data arrives.
If you show up in Realtime, collection works. Missing data in standard reports is then about processing time, date ranges or filters. Jump to Step 5.
If you don't show up, keep going. DebugView gives you more detail.
Step 4: Watch events arrive in DebugView
DebugView shows events from debug devices only, in near real time, with all their parameters. It's the best tool for checking a specific event, like a form submission or a purchase.
Turn on debug mode
Use one of these:
- GTM Preview or Tag Assistant. When you connect, Tag Assistant adds a debug signal, and GA4 treats your session as a debug device.
- A debug_mode parameter. In GTM, add
debug_modewith valuetruein the Google tag's configuration parameters. With gtag.js, add it to the config command. Remove the parameter when you're done. Setting it tofalsedoesn't turn debug mode off; only removing it does.
// gtag.js example: debug mode for all events from this page
gtag('config', 'G-XXXXXXXXXX', { 'debug_mode': true });
Read DebugView
In GA4, open Admin. Under Data display, click DebugView.
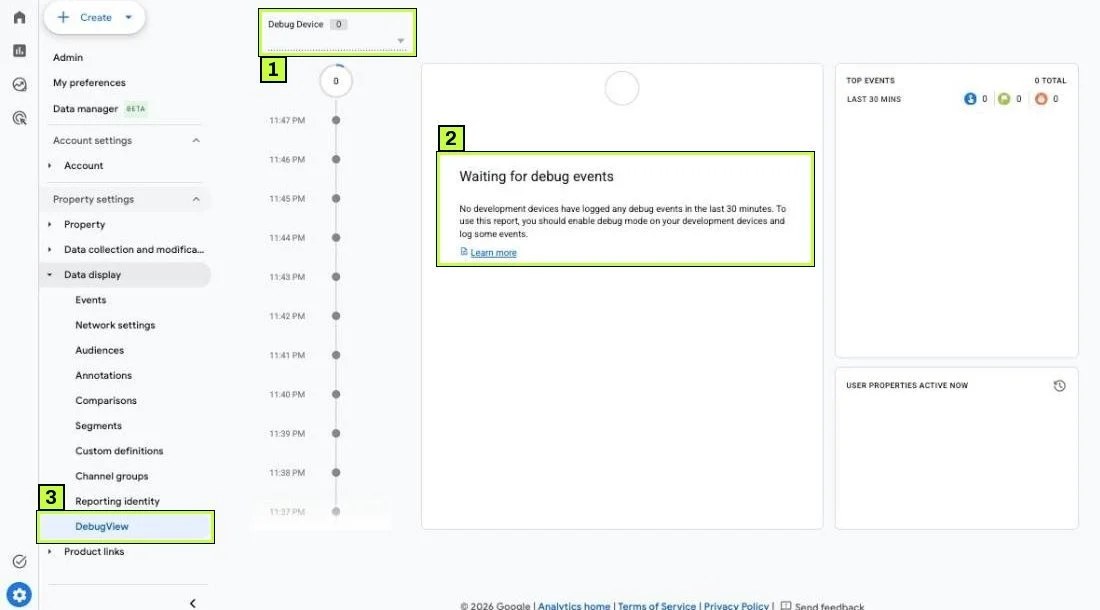
When debug mode works, the Debug Device count goes up and events start appearing in the middle column, minute by minute, with Top events and User properties active now filling in on the right. Pick your own device if several people are testing. Click any event to see its parameters, like page_location or a form ID.
What to look for:
- Nothing at all? Debug mode isn't reaching GA4, or the hits go to another property. Recheck the ID from Step 1 and the hits from Step 2.
- page_view but not your custom event? The event's tag or trigger is the problem. Debug it in GTM Preview: find the action in the left timeline and see whether the event tag fired.
- The event arrives with the wrong name or missing parameters? Fix the event tag. GA4 event names are case-sensitive, so
Generate_Leadandgenerate_leadare different events. - The event arrives but isn't counted as a key event? Mark it as a key event in Admin > Data display > Events by clicking the star next to its name. Our guide to setting up key events in GA4 shows the steps.
DebugView can take a few seconds to show new events. If it stays empty, reload it after clicking around the site again.
Step 5: Rule out consent, filters and blockers
If hits leave the browser but don't show up, or show up in DebugView but not in reports, check these settings.
Consent mode
If your site uses a consent banner with Consent Mode, the Google tag adjusts what it sends based on the visitor's choice. When analytics storage is denied, GA4 doesn't set cookies, and depending on your setup it either sends limited cookieless pings or nothing at all. Google notes that DebugView won't show events when consent mode is active and the user hasn't granted analytics consent.
Test both paths. Accept cookies and confirm events arrive. Then decline and see what's sent. In GTM Preview, the Consent tab shows the state of analytics_storage, ad_storage, ad_user_data and ad_personalization at each step. If tags never fire even after you accept, the banner isn't sending a consent update. Our guide to Consent Mode v2 with GTM covers the setup.
Data filters
Go to Admin > Data collection and modification > Data filters.
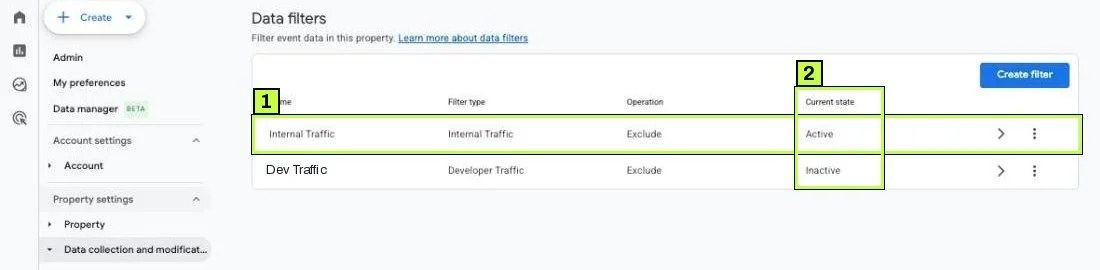
An Active internal traffic filter is the one to look at first. If the IP rule behind it is too broad, it can exclude real visitors. The IP rules themselves live in the Google tag settings under Define internal traffic, not on this screen.
Things that go wrong here:
- An internal traffic rule with a wide IP range, or one that matches a shared office or VPN address everyone uses.
- A developer traffic filter set to active. It excludes events sent with debug mode from your reports, so your test visits won't appear in standard reports. That's working as designed.
- A filter set to Active that was meant to stay in Testing.
Remember that filters only apply from the moment they're active, and excluded data can't be recovered. To fix a bad filter, set it to Testing or Inactive and data will flow from then on.
Blockers and browsers
Ad blockers, privacy extensions and some browsers block requests to Google Analytics. Your own visits may never arrive even when the setup is fine. Test in a clean Chrome profile with extensions off before you conclude anything.
Step 6: Check processing time and report settings
If Realtime and DebugView both show data but standard reports don't, the setup probably works.
- Processing time. Google says many reports and explorations can take 24 to 48 hours to process data. A new property or a new event needs at least a day before you judge it.
- Date range. Many default ranges end yesterday. If the property started today, pick a range that includes today.
- Thresholds. If Google signals is on, GA4 may withhold rows with small user counts to protect privacy. Low-traffic sites can see missing rows. Check the report's data quality icon. (An "(other)" row is a different issue: it groups values when a report has too many unique values.)
- Custom parameters. Event parameters only appear as report dimensions after you register them as custom dimensions in Admin > Data display > Custom definitions. They don't backfill.
Still not working? Common causes
| Symptom | Likely cause | Fix |
|---|---|---|
| Zero data, stream says collection isn't active | Tag missing, wrong ID, or tag never published | Check the ID in Tag Assistant; publish the GTM container |
| Data in a different property | Old or duplicate tag with another G- ID | Remove the extra tag; keep one ID per site |
| Realtime works, reports empty | Processing delay or date range excludes today | Wait 24 to 48 hours; include today in the range |
| Page views fine, one event missing | Event tag or trigger not firing | Debug in GTM Preview, then confirm in DebugView |
| Events visible in DebugView, not in reports | Developer traffic filter active, or processing delay | Expected for debug traffic; test with a normal visit |
| Traffic dropped sharply after a change | New consent banner defaulting to denied without an update | Fix the consent update; test accept and decline |
| Traffic dropped to near zero after a filter change | Internal traffic filter too broad | Set it to Testing and tighten the IP rule |
| Page views counted twice | GA4 hard-coded and in GTM, or Google tag fires twice | Keep one source; check for duplicate triggers |
| Single-page app shows only the first page view | History changes not tracked | Turn on page changes based on browser history in enhanced measurement, or send page_view on route change |
| Your own visits never show up | Ad blocker or privacy extension | Test in a clean profile with extensions off |
| Purchases or leads missing on the thank-you page | Tag doesn't load on that page or platform checkout | Check that page in Tag Assistant; on Shopify, use the supported checkout tracking |
| Event appears with odd names (Form_Submit and form_submit) | Inconsistent naming across tags | Use one lowercase naming pattern and fix the tags |
Data that's there but hidden
Sometimes the data exists but you can't see it. Check the comparisons and filters applied at the top of the report. Check that you're not inside a report collection that someone customized. Try the same date range in an exploration. If the numbers appear there, the data is fine and the report view is the issue.
How to confirm it's fixed
Work through this checklist after each fix:
- Tag Assistant shows the Google tag with your correct
G-ID, and nothing else sending GA4 hits. - In DevTools,
/g/collectrequests return 204 and carry your ID. - Your visit shows in Realtime overview within a couple of minutes.
- In DebugView, each event you care about arrives with the right name and parameters.
- The data stream page no longer warns about inactive collection (this can take up to 48 hours to update).
- After one to two days, the events show up in standard reports such as Reports > Engagement > Events.
Then turn debug mode off by removing any debug_mode parameter you added.
FAQ
How long does GA4 take to show data?
Realtime and DebugView update within seconds to minutes, so your own visit should show up there soon after the tag starts sending hits. Google says many standard reports and explorations can take 24 to 48 hours to process.
Why does DebugView show nothing even though Realtime works?
DebugView only shows debug devices. Turn on debug mode through Tag Assistant, GTM Preview or the debug_mode parameter. Also check consent: if analytics storage is denied, DebugView won't show your events.
Will my debug events count in reports?
They can, unless an active developer traffic filter excludes them. Many teams turn that filter on so testing doesn't inflate the numbers.
Can I recover data lost to a wrong filter?
No. Data excluded by an active data filter is never processed. Fix the filter so new data flows correctly from now on.
Do I need Tag Assistant if I already use GTM Preview?
GTM Preview is Tag Assistant connected to your container. For checking the live, published site without preview, connect Tag Assistant directly with Add domain.
Stuck on this one? We fix these for clients every week. Book a free audit
